
Reports
The Reports section provides statistics and charts for monitoring the performance of facilities, work orders and contractors.
Permissions
Access to the Reports page is controlled by three separate permissions:
| Permission | Grants access to |
|---|---|
| View Reports | Overview, Operations, Performance, and Coverage tabs |
| View Financial Reports | Financial tab (maintenance budget data) |
| View Invoicing Reports | Invoicing tab (contractor invoice data) |
By default, the Facility Manager and Accountant groups have all three permissions.
Filters
At the top of the page you can filter data by:
- Facility - Select a specific facility or view all facilities
- Time period - 7 days, 30 days, 90 days, or 1 year
All KPIs and charts update automatically when filters change.
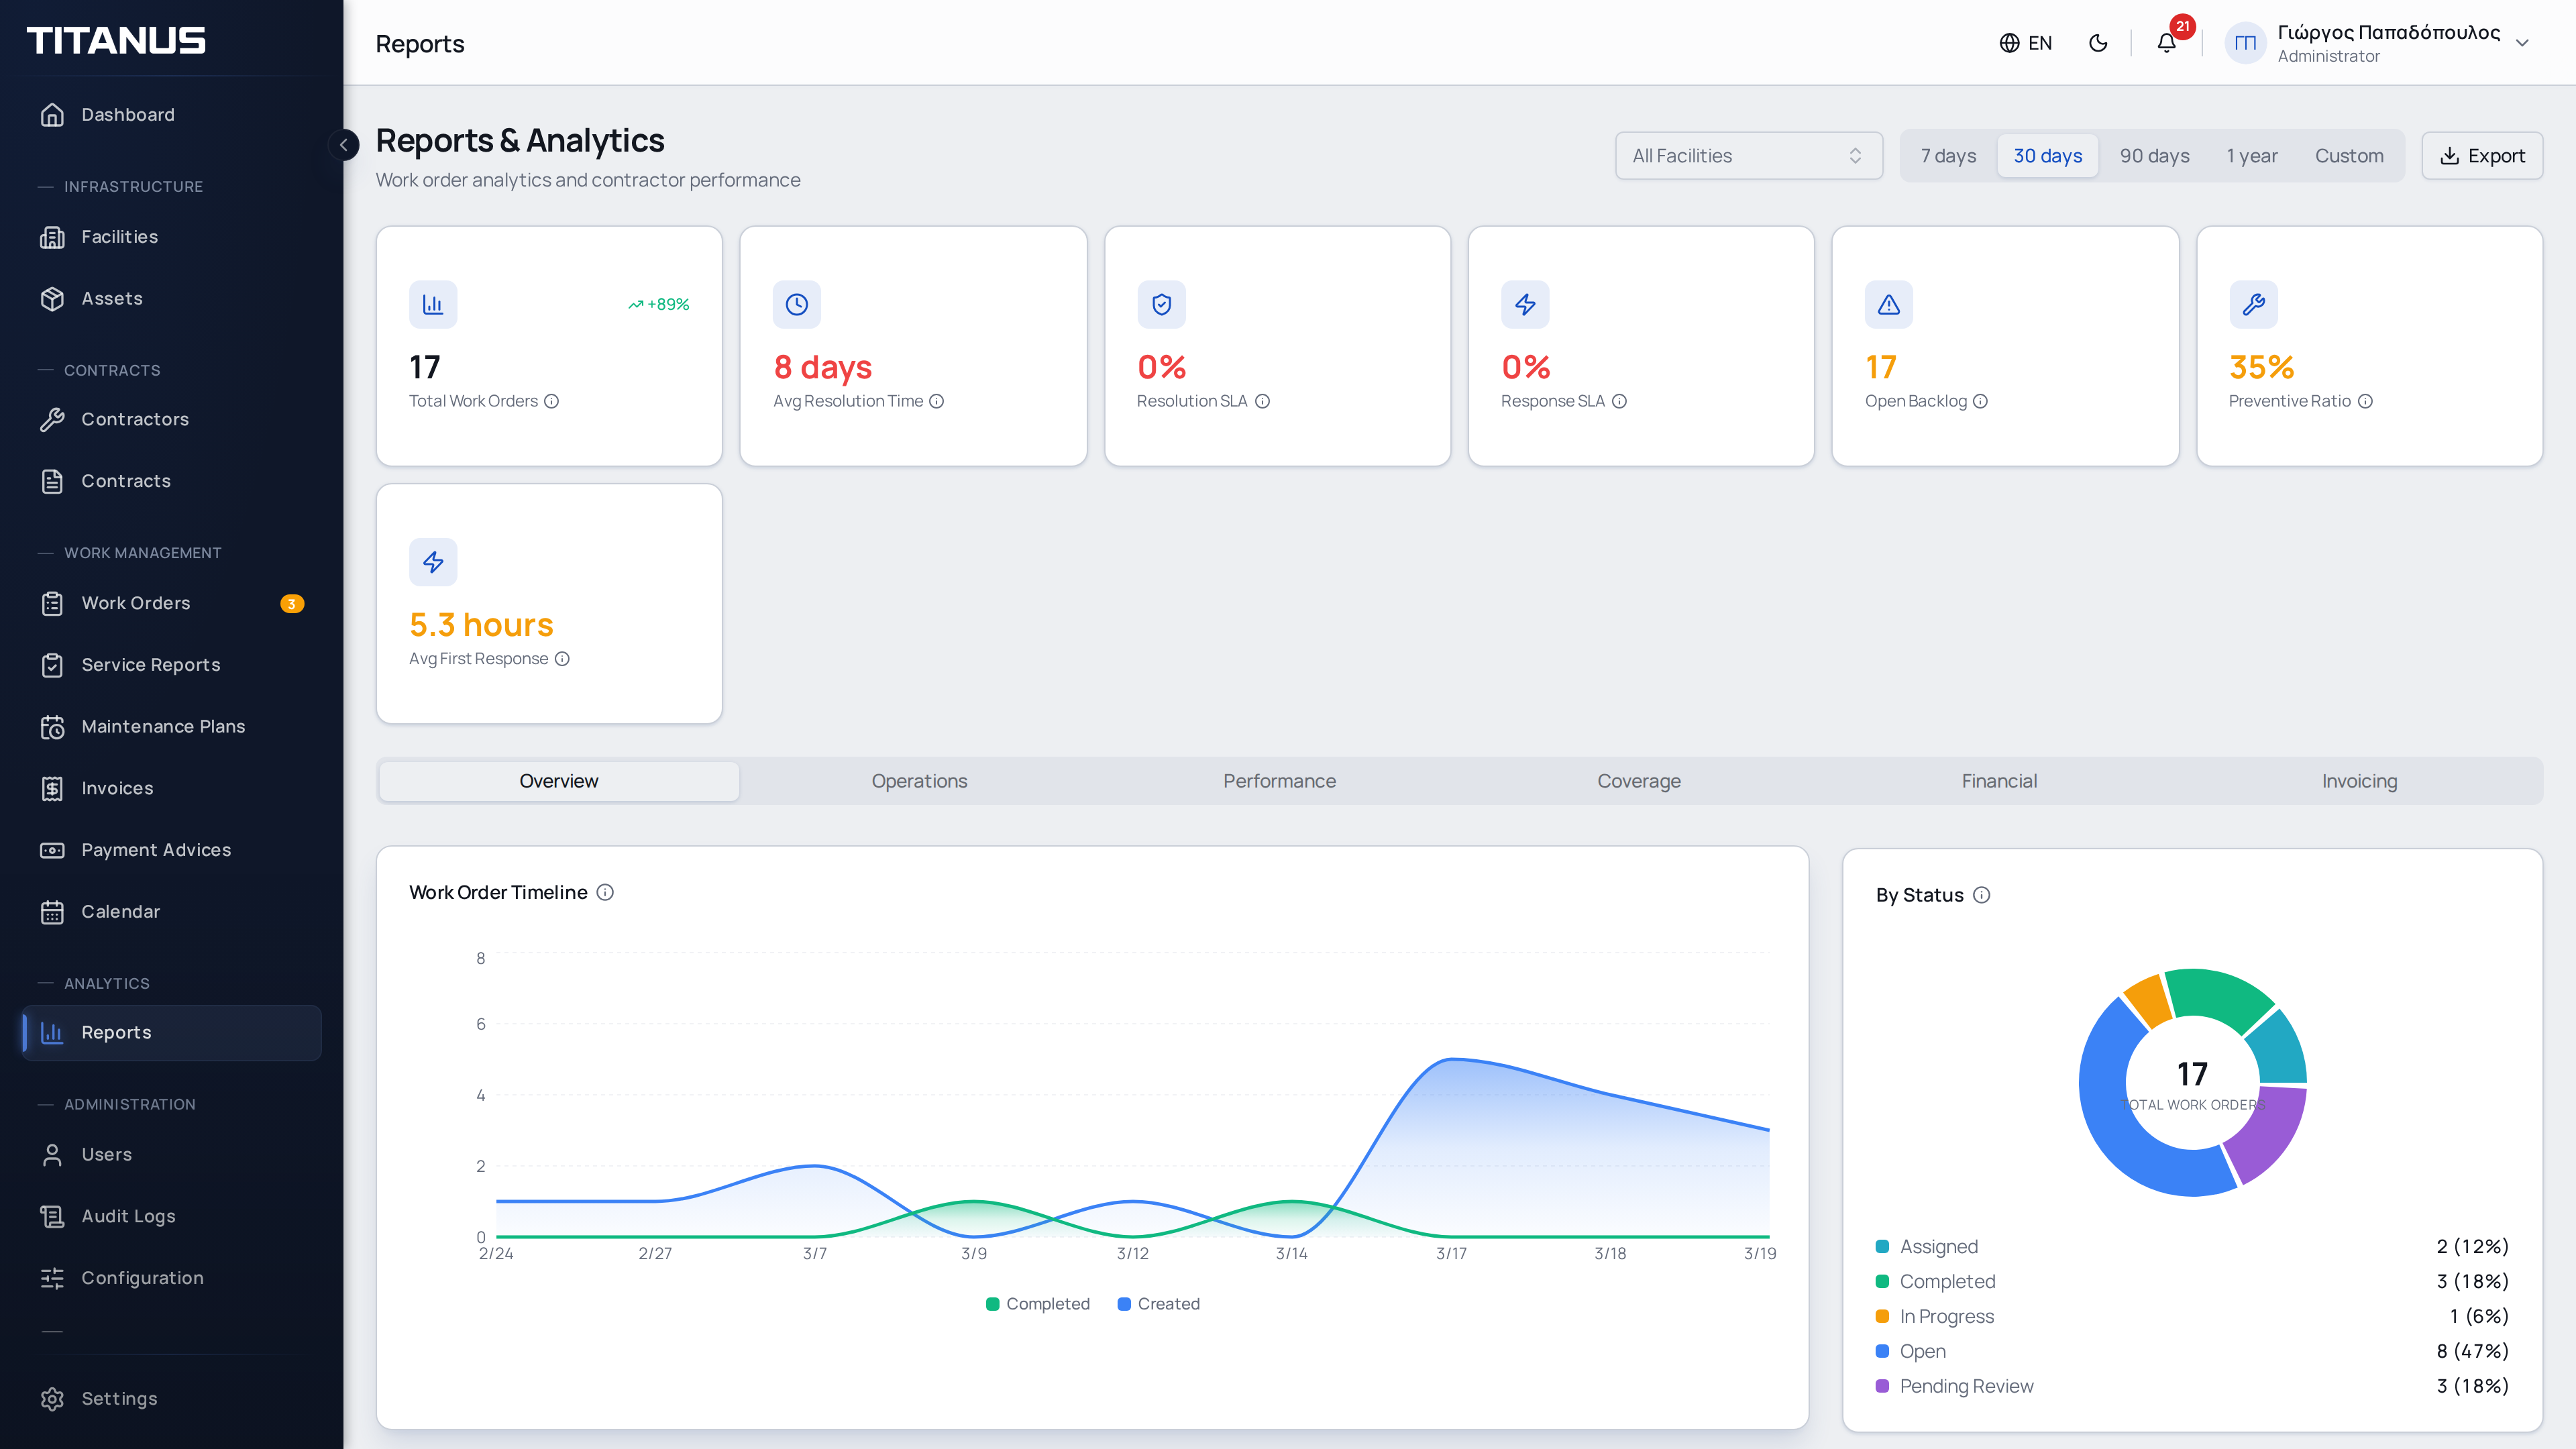
Key Performance Indicators (KPIs)
Six cards at the top of the page show:
| Indicator | Description |
|---|---|
| Total Work Orders | Number of work orders created in the selected period, with % change vs previous period |
| Avg Resolution Time | Average time from creation to completion (hours or days) |
| SLA Compliance | Percentage of orders completed before their due date |
| Open Backlog | Current number of open work orders (not time-filtered) |
| Preventive Ratio | Percentage of preventive vs total work orders - higher means more proactive maintenance |
| Avg First Response | Average time until a contractor is notified |
Each KPI is color-coded: green (good), yellow (warning), or red (needs attention).
Tabs
Charts are organized into four tabs:
Overview
- Work Order Timeline - Line chart showing orders created and completed per day
- Orders by Status - Donut chart with distribution by status (open, assigned, in progress, completed, cancelled)
- Orders by Priority - Bar chart by priority level (low, medium, high, urgent)
- Orders by Type - Bar chart by work type (corrective, preventive, inspection, quote)
Operations
- Work Order Aging - Shows how old open work orders are, in buckets: < 24h, 1–3 days, 3–7 days, 7–30 days, > 30 days. Color escalates from green to red
- SLA Compliance Trend - Stacked area chart showing on-time vs late completions over time
- Top Problem Types - Most frequently reported problem types (top 10)
- By Asset Category - Work orders grouped by asset category (top 10)
Performance
- Contractor Performance - Each contractor's total assignments, completed, overdue, and completion rate with progress bar
- Technician Hours - Total net work hours, average per work order, service report count, and technicians deployed
- Top Problematic Assets - Assets with the most work orders (top 10) - identifies equipment needing replacement
Coverage
- Contract Coverage - Donut chart showing what percentage of facilities are covered by active contracts
- Orders by Facility - Horizontal bar chart showing which facilities have the most work orders (top 10)
Usage
- Use Work Order Aging to spot orders that are getting stale and need escalation
- Monitor SLA Compliance to track service level adherence over time
- Check Preventive Ratio regularly - a higher ratio means fewer emergency repairs
- Review Contract Coverage to identify facilities without active maintenance contracts
- Use the Facility filter to drill down into individual facility performance
Export
You can export all report data for offline analysis or sharing. Click the Export button in the top-right corner and choose a format:
- Export to Excel (.xlsx) - Multi-sheet workbook with all KPIs, breakdowns, contractor performance, and financial data (if available)
- Export to PDF - Formatted summary document with tables for all report sections
Exports respect the currently active filters (facility and time period), so the exported file matches exactly what you see on the page.